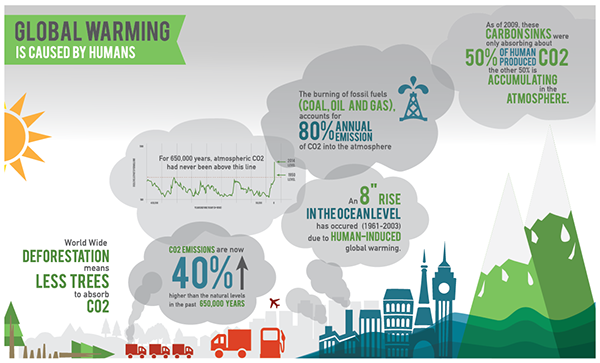
Visual: The data is presented in bad gases like carbon dioxide, and in dark colours to show that the environment has been getting from bad to worse. The harmful gases are from cities and forests and factories to show that these are the main contributions to the adverse change to the environment.
Textual: Terms relating to Earth, like "ocean", "atmosphere" used to show that what the humans have been doing really makes a significant impact to the environment. Also, the term "CO2" which stands for carbon dioxide is used to show that the amount of harmful gas we have been releasing is really impacting the environment, to make things worse, deforestation which means "less trees to absorb CO2" as mentioned in the text.
Typography: Keywords in the "bad gases" such as the causes of the adverse change and the change in statistics like percentage increase are larger to show the drastic changes and what we have been doing that made a significant impact in our environment.
Layout: The main statistics are presented like clouds and are placed in the sky. Some of the words that are key are enlarged.
Purpose: To inform people of the drastic changes in the environment, and trying to persuade them to make the change so that the environment may be improved.
Audience: General Public
Context: The amount of Carbon Dioxide has been increasing lately which contributes to Global Warming. A key reason is that of human activities like the burning of fossil fuels for electricity. Therefore, through designing this visual text, the creator hopes to advocate on this issue and persuade them to take action on the issue.
Culture: Many people think that the environment wouldn't turn that bad so these people don't take action regardless.
Message: The poster is to encourage people to take action on the recent changes in the environment.
No comments:
Post a Comment